Have you ever wondered how traders predict market reversals with such precision? Enter the butterfly harmonic pattern, a powerful reversal tool that has captivated technical analysts worldwide. Based on specific Fibonacci ratios, the butterfly chart pattern allows traders to anticipate trend reversals before they fully unfold, giving them a critical timing advantage.
Whether you’re trading forex, stocks, gold, or crypto, understanding butterfly pattern trading can give you a significant edge. In this article, we’ll cover everything: what the butterfly harmonic pattern is, how to identify and validate it, the best markets and timeframes, and step-by-step trade setups for both bullish and bearish scenarios.
What is the Butterfly Harmonic Pattern?
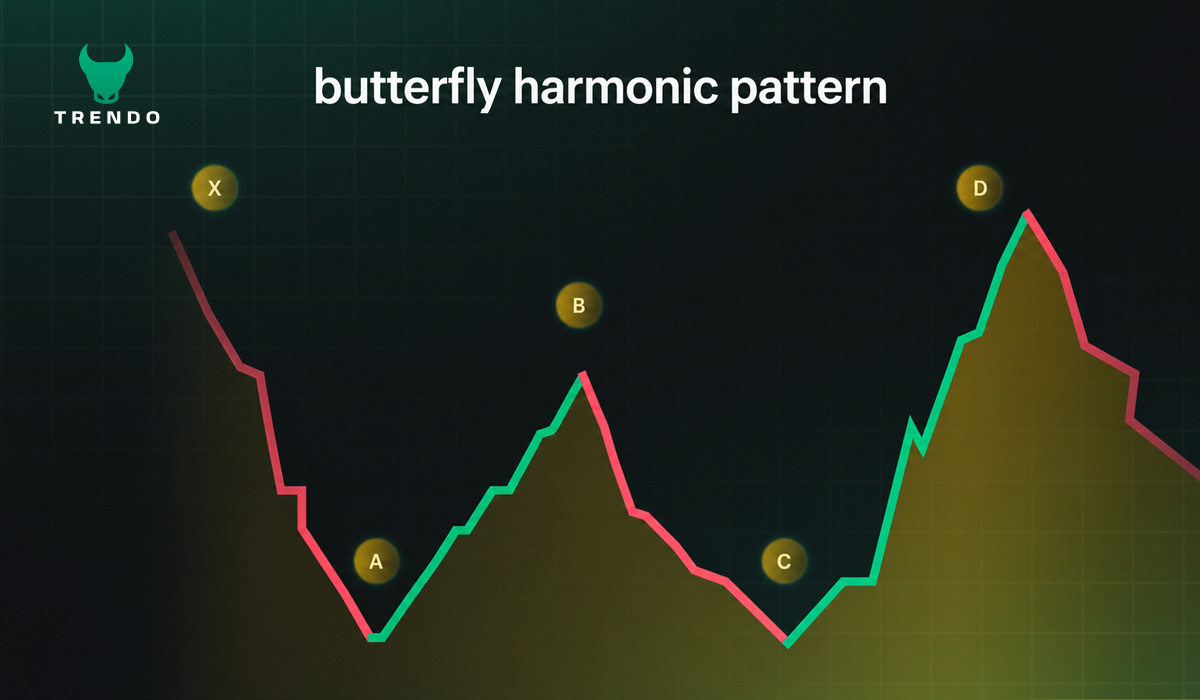
The butterfly harmonic pattern is a precise reversal pattern in technical analysis consisting of four price legs, X-A, A-B, B-C, and C-D, that together form a shape resembling butterfly wings. Unlike general chart patterns, the butterfly trading pattern relies on strict Fibonacci measurements to define each leg, making it one of the most rule-based harmonic patterns in trading.
Traders use the butterfly pattern to identify potential reversal zones (PRZ) where price is likely to change direction. Bryce Gilmore developed the pattern, which Scott Carney later refined as part of the harmonic trading framework. It’s closely related to other harmonic patterns like the Gartley and the Bat, but is distinguished by its extension beyond the starting point X.
If you want to explore more harmonic trading setups, learn how traders use Gartley and Bat patterns to identify high-probability market reversals.
Types of Butterfly Patterns
The butterfly chart pattern comes in two forms: bullish and bearish. Both signal a potential trend reversal but in opposite directions.
Bullish Butterfly Pattern
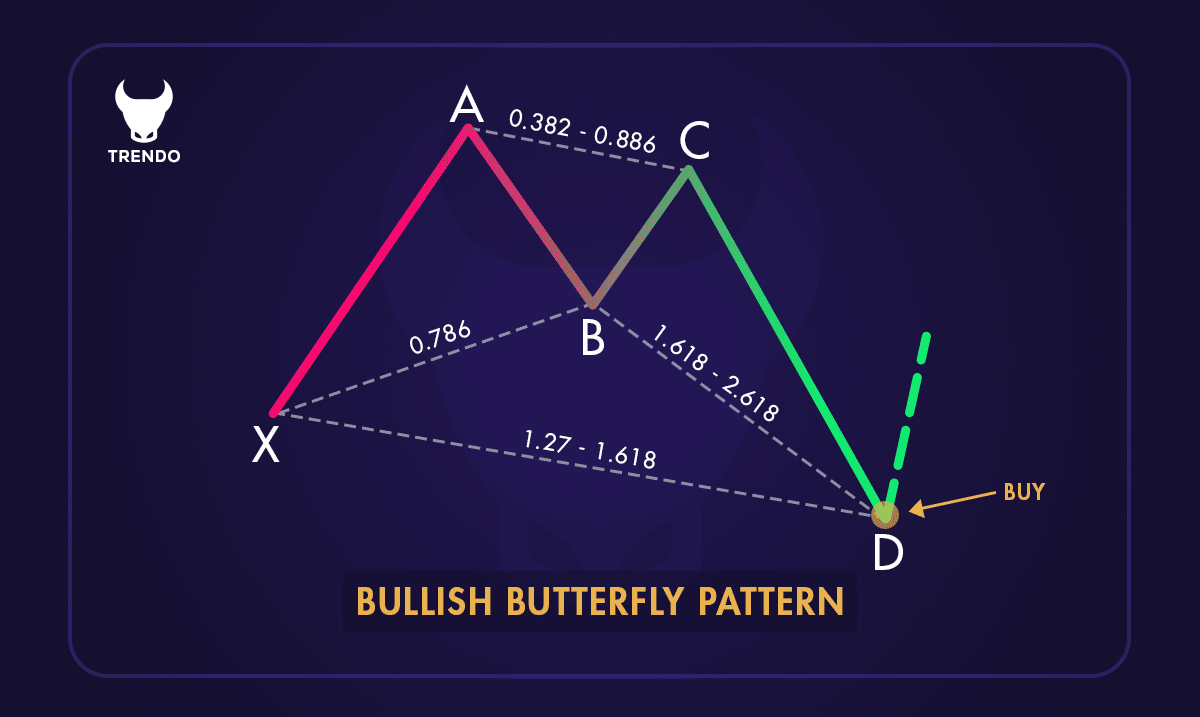
The bullish butterfly pattern forms at the end of a downtrend and signals a potential upward reversal. Here is how each leg behaves:
- X-A Leg: The initial upward price move that establishes the pattern foundation.
- A-B Leg: A downward retracement, typically reaching 78.6% of the X-A leg.
- B-C Leg: An upward move that retraces between 38.2% and 88.6% of the A-B leg.
- C-D Leg: The final downward extension, reaching 127.2% to 161.8% of the X-A leg, going below point X.
When the C-D leg completes at point D, the bullish butterfly pattern signals a buy opportunity. Point D is always below the original X point, which distinguishes the butterfly from the Gartley pattern.
When the C-D leg completes at point D, the bullish butterfly pattern signals a buy opportunity. Point D is always below the original X point, which distinguishes the butterfly from the Gartley pattern.
Bearish Butterfly Pattern
The bearish butterfly pattern forms at the end of an uptrend and signals a potential downward reversal. The structure mirrors the bullish version:
- X-A Leg: The initial downward price move.
- A-B Leg: An upward retracement of approximately 78.6% of X-A.
- B-C Leg: A downward move retracing 38.2% to 88.6% of the A-B leg.
- C-D Leg: The final upward extension reaching 127.2% to 161.8% of X-A, going above point X.
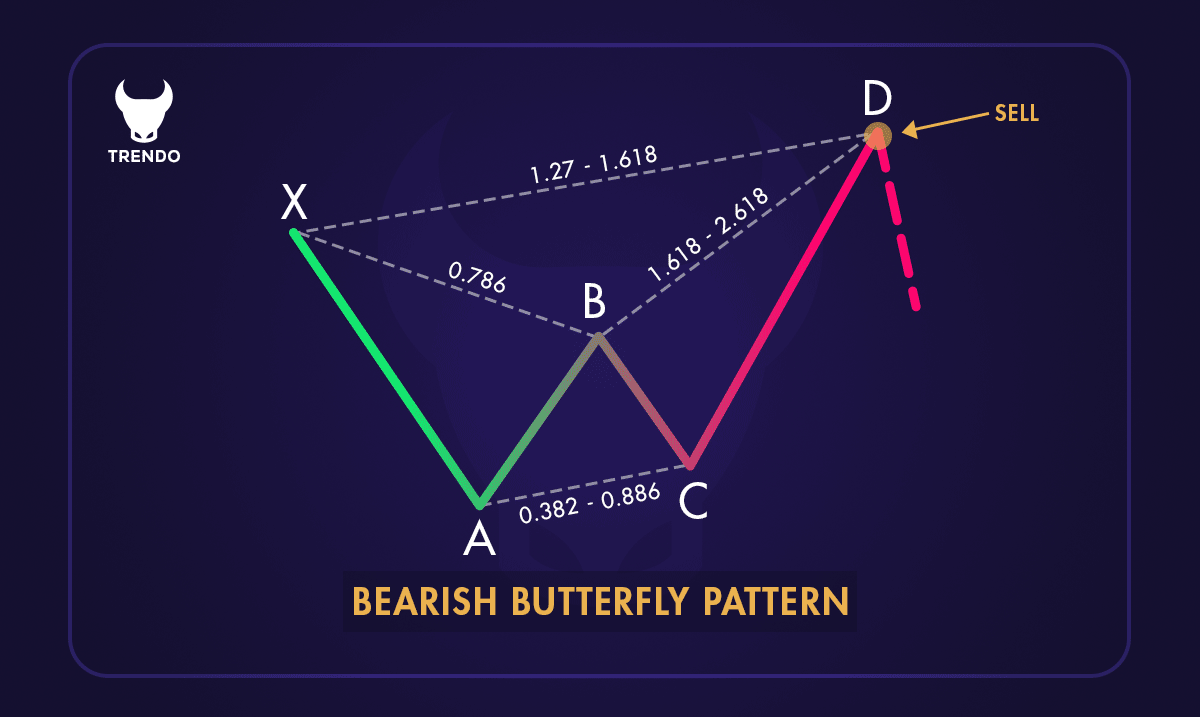
At point D, the bearish butterfly pattern triggers sell signals. Traders look for confirmation candlesticks before entering short positions.
Key Components and Fibonacci Rules
Every valid butterfly harmonic pattern must meet the following Fibonacci ratio requirements:
- A-B retracement: exactly 78.6% of X-A (this is the defining rule for the butterfly vs. Gartley)
- B-C retracement: between 38.2% and 88.6% of A-B
- C-D extension: between 127.2% and 161.8% of X-A (the PRZ, Potential Reversal Zone)
- D point must extend beyond X. This is what gives the pattern its butterfly wing shape
If any of these ratios deviate significantly, the pattern should be considered invalid. Use a Fibonacci retracement tool on each leg carefully before trading.
How to Identify the Butterfly Pattern?
Spotting the butterfly chart pattern requires a methodical step-by-step approach:
- Find the X-A Leg: Look for a clear directional move. This is your baseline.
- Measure the A-B Leg: Apply your Fibonacci tool from A to X. The B point should land near the 78.6% level.
- Check the B-C Leg: Apply Fibonacci from B to A. The C point should fall between 38.2% and 88.6%.
- Project the C-D Leg: Apply a Fibonacci extension from C (using the X-A leg). Target the 127.2%–161.8% extension zone as your expected D point.
- Wait for Price to Reach D: Do not enter a trade before D is confirmed. The butterfly trading pattern is only valid at completion.
Most modern trading platforms have built-in harmonic pattern drawing tools that can help you identify butterfly patterns automatically. You can also find dedicated indicators under the Indicators section by searching ‘Harmonic Patterns’.
How to Validate a True Butterfly Pattern (Validation Rules)
Not every shape that looks like a butterfly pattern is a valid signal. Before entering a trade, confirm the following:
- Fibonacci Precision: The A-B retracement must be close to 78.6% of X-A. Deviations beyond 3–5% invalidate the butterfly harmonic pattern.
- D Point Extension: Point D must exceed point X. If it doesn’t, you may be looking at a Gartley or Bat, not a butterfly chart pattern.
- Structural Symmetry: The overall shape should have clear swing points at X, A, B, C, and D, no overlapping legs.
- Confirmation Candle: Wait for a reversal candlestick signal at point D, such as a pin bar, engulfing candle, or doji, before entering the trade.
- Volume Confirmation: Rising volume at point D strengthens the reversal signal for the butterfly pattern trading setup.
- Supporting Indicators: Use RSI divergence, MACD crossovers, or proximity to a key support/resistance level to add confluence.
False signals are more common in choppy or low-liquidity markets. The butterfly harmonic pattern works best when it aligns with a broader market structure and a clear trend before the pattern formation.
How to Trade the Butterfly Pattern?
Once a butterfly harmonic pattern is identified and validated, here is how to execute the trade:
Long Setup (Bullish Butterfly Pattern) with Chart Example
The bullish butterfly pattern forms during a downtrend. After point D completes below X, you look for a buy entry:
- Entry: Enter a buy order at point D after a bullish confirmation candle closes.
- Stop-Loss: Place the stop-loss slightly below point D (typically 1–2 ATR units below). If price breaks below D, the butterfly pattern is invalidated.
- Take-Profit Targets:
- Target 1: 38.2% retracement of the C-D leg (partial profit)
- Target 2: 61.8% retracement of the C-D leg
- Target 3: Point B or point A for the full move
Short Setup (Bearish Butterfly Pattern) with Chart Example
The bearish butterfly pattern forms at market tops. After point D completes above X, you look for a sell entry:
- Entry: Enter a sell order at point D after a bearish confirmation candle closes.
- Stop-Loss: Place the stop-loss slightly above point D. A close above D signals the butterfly stock pattern has failed.
- Take-Profit Targets:
- Target 1: 38.2% retracement of the C-D leg
- Target 2: 61.8% retracement of the C-D leg
- Target 3: Point B or point A
Best Timeframes for Trading the Butterfly Pattern
The butterfly harmonic pattern appears on all timeframes, but not all timeframes are equally effective. Here are the recommended ones:
- 1-Hour Chart (H1): Suitable for intraday traders. Offers a balance between signal frequency and reliability. Good for butterfly pattern trading in active sessions.
- 4-Hour Chart (H4): The most popular timeframe for butterfly chart pattern trading. Reduces false signals and gives enough room for profit targets to be reached.
- Daily Chart (D1): Best for swing traders. Butterfly trading patterns on the daily chart carry higher reliability and larger profit targets. Ideal for butterfly stock pattern analysis.
- Weekly Chart (W1): Best for position traders and investors. The butterfly harmonic pattern on higher timeframes aligns with major market turning points.
Tip: Always check the higher timeframe for trend direction. A bullish butterfly pattern on H4 is more reliable if the daily chart is in an overall uptrend.
Best Markets for the Butterfly Pattern (Forex, Gold, Crypto)
The butterfly harmonic pattern is a universal technical pattern. However, some markets lend themselves better to butterfly pattern trading:
- Forex: The forex market is ideal for butterfly chart pattern trading due to its high liquidity and the frequency of harmonic price swings. Currency pairs like EUR/USD, GBP/USD, and USD/JPY regularly produce well-defined butterfly trading patterns.
- Gold (XAUUSD): Gold is highly responsive to technical levels, making it one of the best assets for butterfly harmonic pattern setups. Fibonacci levels on gold tend to hold with precision.
- Cryptocurrencies (Bitcoin, Ethereum): In volatile crypto markets, the butterfly pattern trading approach helps traders identify potential reversal zones during extended trends. Bitcoin and Ethereum show clear harmonic structures on higher timeframes.
- Stocks and Indices: The butterfly stock pattern appears frequently in equities, particularly at the end of trending moves. Applying the butterfly chart pattern to stock indices like the S&P 500 or Nasdaq can highlight major reversal zones.
- Commodities (Oil, Silver): Commodities often form textbook butterfly harmonic patterns during corrective phases, providing clean setups for disciplined traders.
Trade Butterfly patterns with advanced charts, fast execution, and seamless market access on Trendo.
Advantages of Butterfly Pattern Trading
Incorporating butterfly pattern trading into your strategy offers several key benefits:
- High Accuracy: The butterfly harmonic pattern uses strict Fibonacci rules, resulting in high-probability reversal signals when properly validated.
- Clear Entry and Exit Points: The butterfly chart pattern provides well-defined trade parameters — entry at D, stop just beyond D, and profit targets at Fibonacci retracements.
- Effective Risk Management: The defined stop-loss placement makes it easier to calculate risk/reward ratios before entering a trade.
- Versatility Across Markets: The butterfly trading pattern works in forex, stocks, commodities, and crypto — making it a universal technical tool.
- Predictive Power: The butterfly harmonic pattern identifies potential reversal zones before price reaches them, giving traders early positioning opportunities.
Challenges and Limitations of the Butterfly Pattern
Despite its power, butterfly pattern trading has real limitations:
- Complexity: Correctly measuring all four legs and their Fibonacci ratios demands experience and attention to detail.
- Identification Difficulty: Real-time identification of the butterfly chart pattern is harder than it looks. Incomplete patterns can easily fool traders into premature entries.
- False Signals in Volatile Markets: In high-volatility or news-driven conditions, the butterfly harmonic pattern may form but fail to reverse as expected.
- Reliance on Confirmation: The butterfly trading pattern should never be traded in isolation. Always combine it with candlestick signals, volume, or indicator confluence.
- Time-Intensive Analysis: Precisely validating each Fibonacci ratio takes time, making the butterfly pattern less suitable for very short-term scalping strategies.
Tips for Trading with the Butterfly Pattern
- Master the Fibonacci ratios:
The 78.6% A-B retracement is the defining rule of the butterfly harmonic pattern. Get this right first. - Use charting tools:
Leverage TradingView’s harmonic pattern tools or dedicated harmonic indicators to identify the butterfly chart pattern automatically. - Wait for confirmation:
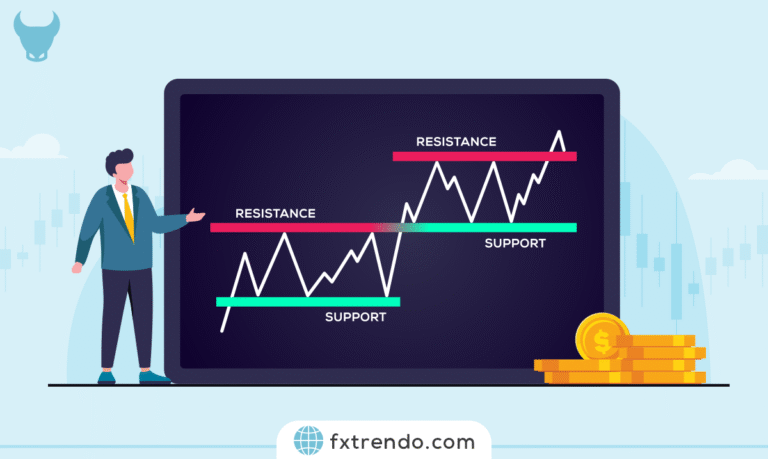
Never enter a butterfly pattern trading setup before a confirmation candle closes at point D. - Combine with S/R levels:
A butterfly stock pattern or forex setup at a major support or resistance zone is far more reliable. - Manage risk strictly:
Always use stop-losses just beyond point D and define your risk/reward ratio before entry. - Backtest before going live:
Test the butterfly trading pattern on historical data for your specific market and timeframe before risking real capital.
Conclusion
The butterfly harmonic pattern is one of the most precise and reliable reversal tools in technical analysis. When properly identified and validated using Fibonacci ratios, butterfly pattern trading offers high-probability entries with clearly defined risk parameters.
Whether you apply the bullish butterfly pattern in downtrends or the bearish butterfly pattern at market tops, combining this butterfly chart pattern with volume, candlestick confirmation, and key support/resistance levels will significantly improve your trading performance. Mastery of the butterfly harmonic pattern takes practice — but the reward in trading accuracy is well worth the effort.
Ready to put harmonic trading strategies into action? Create your Trendo account and start trading!